Most of my research revolves around Topological Data Analysis, a relatively new field at the intersection of applied mathematics, computer and data science. It empowers rigorous methods and tools from computational geometry and topology to extract information from, possibly large, complex and high-dimensional datasets.
Here are some of my research projects, a comprehensive list can be found in my Google Scholar.
The Euler characteristic is probably one of the oldest topological invariants, in this work we analyze it in the context of filtered data. By building a filtered cell complex on top of it and tracking the evolution of its Euler characteristic at different scales we obtain an Euler characteristic curve, which can be used as a topological feature.
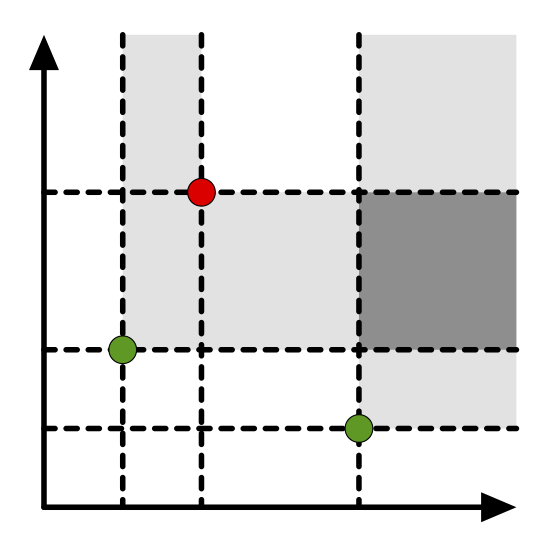
We prove a novel stability result, bounding the distance between two Euler characteristic curves obtained from two filtered complexes with the Wasserstein distance between their persistence diagrams, a widely studied distance in TDA for which many stability results are known. Moreover, we generalize the Euler characteristic curve to complexes whose filtrations take values in a general poset, thus lifting it in the realm of multiparameter persistence. We call this generalization Euler characteristic profile.
Our stability results justify the use of Euler characteristic curves and profiles as data descriptors. In order to do so, we provide distributed algorithms to compute them in an efficient way for different types of data, leveraging the combinatorial structure of different types of cell complexes, namely Vietoris-Rips simplicial complexes and cubical complexes. Our proposed algorithms are fully parallelizable and can be executed in a streaming fashion, without the need to load the entire input into memory all at once. This paves the way for TDA applications in big data scenarios.
We introduce new techniques to visualize high-dimensional data and relations, inspired by the famous Mapper algorithm and one of its variations, Ball Mapper.
We apply such new tools to data consisting of polynomial invariants for a large collection of topological knots and show how TDA techniques could help discovering new results in theoretical mathematics. In particular, we show how a mapper-based analysis of a large collection of Alexander and Jones polynomials is able to recover a theorem by Conway and provides a novel geometric interpretation of such result. Moreover, our analysis hints to the existence of, currently unknown, relations between knot invariants.
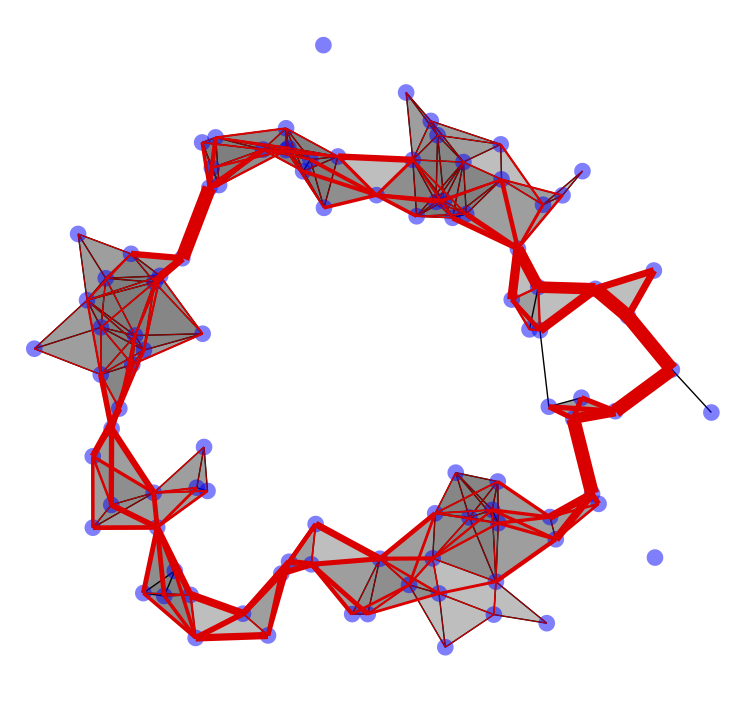
And yes, you guessed right, the image on my homepage is a plot of the complex roots of the Alexander polynomials for all prime knots up to 17 crossings.The main motivation of this work is solving the inverse problem of mapping back the information from persistence barcodes to the data they were computed from. In other words, we would be interested in associating to each bar in a persistence barcode a specific representative cycle. However, each bar in the barcode corresponds to a specific homology class, which is an equivalence class of cycles and there is no canonical way to choose a specific one.
The method we propose is based on the concept of harmonic cycles, which are particular cycles with the property of being orthogonal to the subspace of boundaries. Each homology class has exactly one, unique harmonic cycle, and it can be shown that such cycles are optimal in the sense that they have the minimal norm among all homologous cycles.
We implement our algorithm into a data analysis pipeline that allows to assign harmonic weights to samples or features, and use these weights as input for various machine learning models. We apply this methodology to molecular biology data, showing how harmonic persistent homology can be effectively used to extract topological features from complex, high-dimensional datasets.
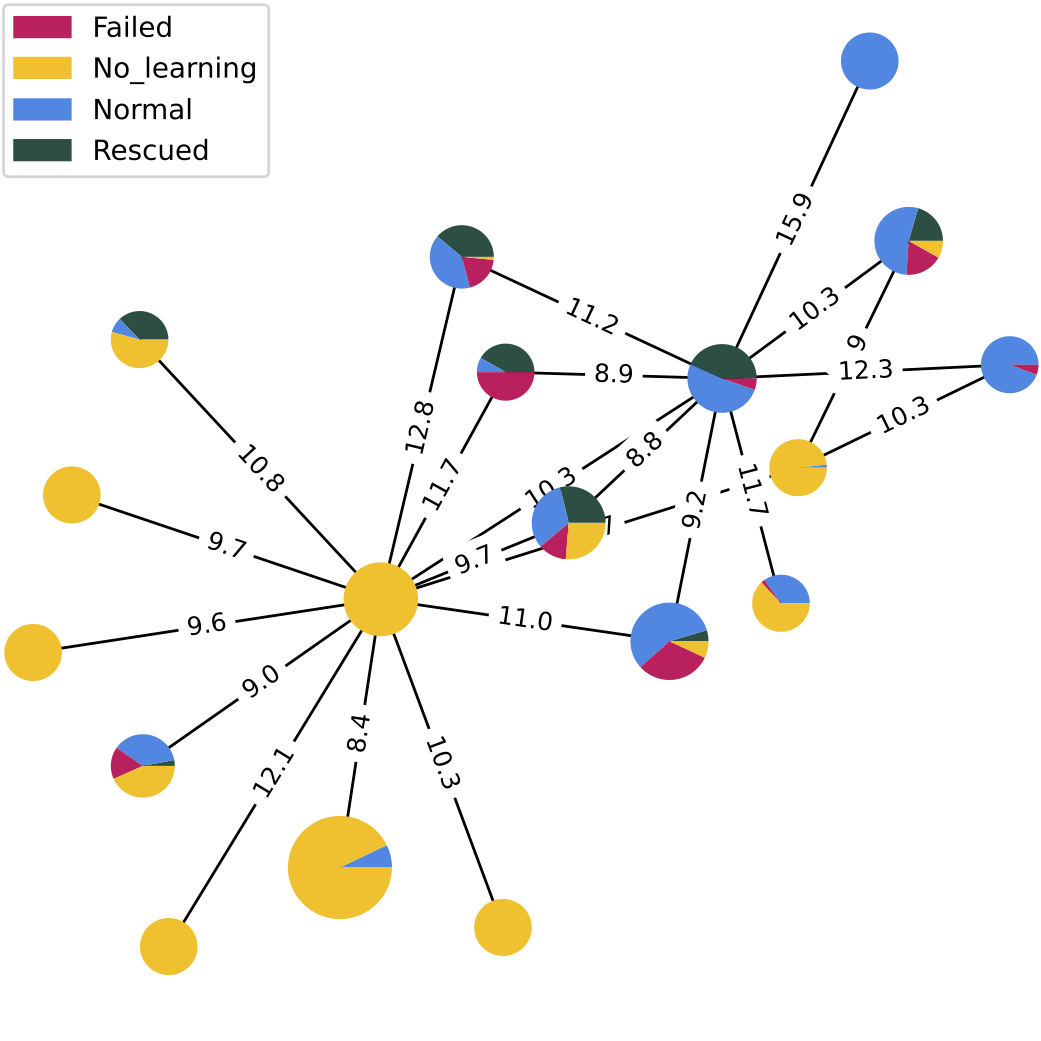
In December 2024 I spoke about this project at the Applied Algebraic Topology Network seminar.This project aims to bridge the gap between clustering algorithms and dimensionality reduction-based visualization techniques. We introduce ClusterGraph, a new data structure built on the output of a clustering algorithm that allows to visualize the global layout of the data. For a given datasets partitioned into clusters, ClusterGraph is an complete undirected graph whose vertices represent the clusters and edges are weighted by the distance between corresponding clusters, according to some similarity measure.
We propose a score function to evaluate how well this representation agrees with the underlying shape of the data, and propose two pruning strategies to remove edges from the complete graph while still conserving most of the information. We showcase this construction alongside the output of the most used dimensionality reduction tools, demonstrating how their combined use helps capturing more information on the data's local and global layout.